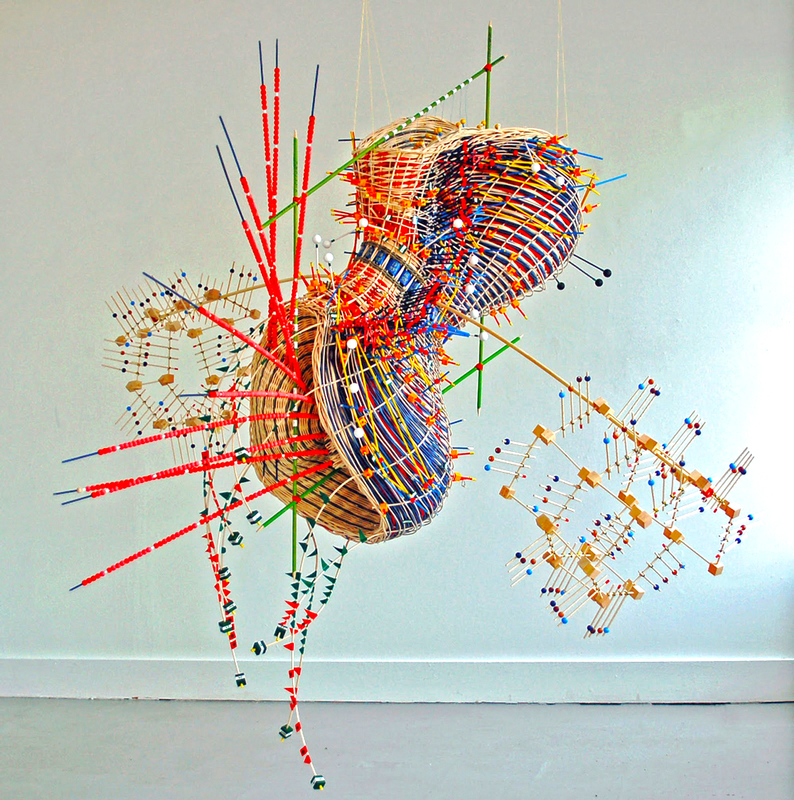
- Artist Nathalie Miebach takes weather data from massive storms and turns it into complex sculptures that embody the forces of nature and time (figure 1). These sculptures then become musical scores for a string quartet to play.
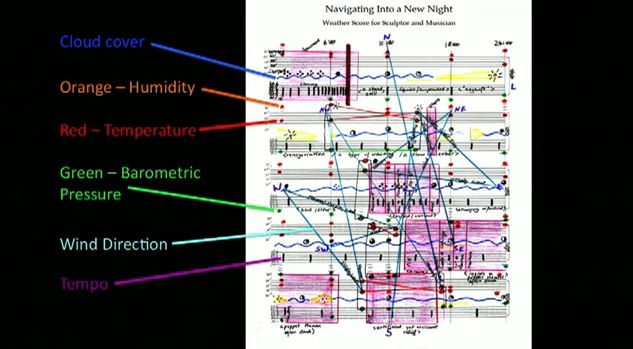
- The musicians played off a three-dimensional graph of weather data. Every single bead, every single coloured band, represents a weather element that can also be read as a musical note.
- Weather is a combination of systems that is fundamentally invisible to most of us. Artist Nathalie Miebach used a sculpture and music to make weather data, not just visible, but also tactile and audible.
Reflection
Throughout all the lectures we have seen many examples of screen-based data visualisations. This example shows the possibility to make visualisations that are three-dimensional giving a tactile and audible experience.
